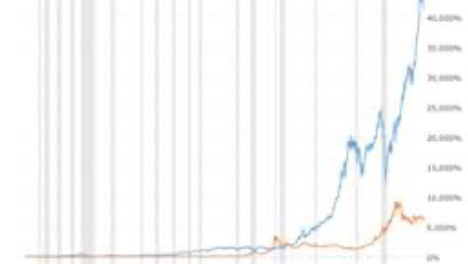
Over the last 100 years, the price of gold has varied significantly, experiencing periods of both significant growth and decline. Here are some key trends in the performance of gold over the past century:
- From 1915 to the early 1970s, the price of gold was generally stable, with the U.S. government setting/fixing the price at $35 per ounce under the Bretton Woods system. Yes that’s correct first they made it illegal to own gold, then they raised and controlled the price of it. During this time, the value of the dollar was tied/backed to/by gold, meaning that the price of gold was fixed in relation to the dollar.
- In the early 1970s, the U.S. government ended the gold standard, and the price of gold began to rise. From 1971 to 1980, the price of gold rose from $35 per ounce to over $800 per ounce, due in part to concerns about inflation, political instability, and economic uncertainty.
- In the 1980s and 1990s, the price of gold declined, falling to a low of around $250 per ounce in the late 1990s. This decline was due in part to low inflation, economic stability, and a strong U.S. dollar.
- From the early 2000s to the present day, the price of gold has risen significantly, reaching all-time highs of over $2000 per ounce in August 2020 This increase in price was driven by a variety of factors, including low interest rates, economic uncertainty, COVID/Pandemic and demand from emerging markets like China and India.
Overall, while the price of gold has varied significantly over the last 100 years, it has generally performed well as a long-term investment. Despite short-term fluctuations, gold has historically been a great store of value and a hedge against inflation and economic uncertainty.
Price of gold from 2000 to 2023
Here are the annual average prices of gold from 2000 to 2022:
- 2000: $279.11
- 2001: $271.04
- 2002: $310.25
- 2003: $363.83
- 2004: $409.72
- 2005: $444.74
- 2006: $605.16
- 2007: $695.39
- 2008: $872.37
- 2009: $972.35
- 2010: $1,224.53
- 2011: $1,571.52
- 2012: $1,669.86
- 2013: $1,411.02
- 2014: $1,266.40
- 2015: $1,160.33
- 2016: $1,251.67
- 2017: $1,260.39
- 2018: $1,268.93
- 2019: $1,393.34
- 2020: $1,773.73
- 2021: $1,817.89
- 2022: $1,801.87
It’s worth noting that the price of gold can be highly volatile and subject to a range of factors, including global economic and political conditions, supply and demand dynamics, inflation, interest rates, and currency exchange rates. Therefore, these prices represent historical averages and are not necessarily indicative of future performance.